
Ed Davies
-
Posts
1674 -
Joined
-
Last visited
-
Days Won
1
Everything posted by Ed Davies
-

Permitted Development Trade - how it works
Ed Davies replied to Hilldes's topic in Planning Permission
If you do the PD extensions that's it, the PD has been used up and you can't build anything else. But, if they give you permission for a new house wouldn't that have PD rights to extend further? Or is the expectation that the new PP will have PD rights withdrawn (article 4 notice, or whatever)? So if you do the rebuild you might finish up with a house you want but maybe without PD rights for other things, e.g., garden sheds and the like. -
I hope you can get a good supply of those. I think you'd need at least four on the mower and even then they'd not last long. The labelled Ah capacity might seem enough but if you deep discharge them (say more than 50% of capacity), particularly at high current, they'll die pretty quickly.
-
No experience myself but I suspect they're poor. I have a VAir monitor which works well but unfortunately the chap who was making them has given up as he wasn't making enough charging €80 each. He was on a bit of a personal crusade about air quality in Sofia and had researched the various sensors for CO₂, particulates, etc, quite carefully and was selling other boxes (with just temperature and humidity sensors) for €20 or so (with a very thin markup, I suspect) so I think if there was a cheaper sensor available which worked reasonably well he'd have used it.
-
I think that's how more serious airtightness tests are done. E.g, when they tested the airtightness of Biosphere 2 they released some harmless trace gas then measured the way it decreased with laboratory-style equipment. IIRC, they got significantly less than one ACY (air change/year).
-
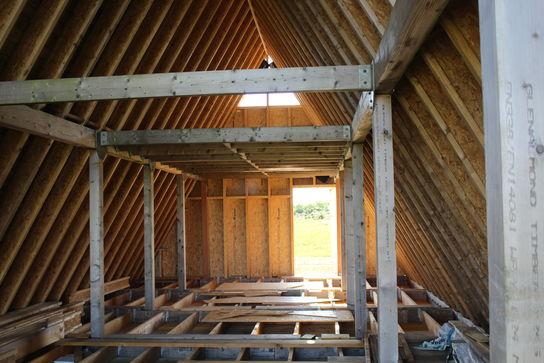
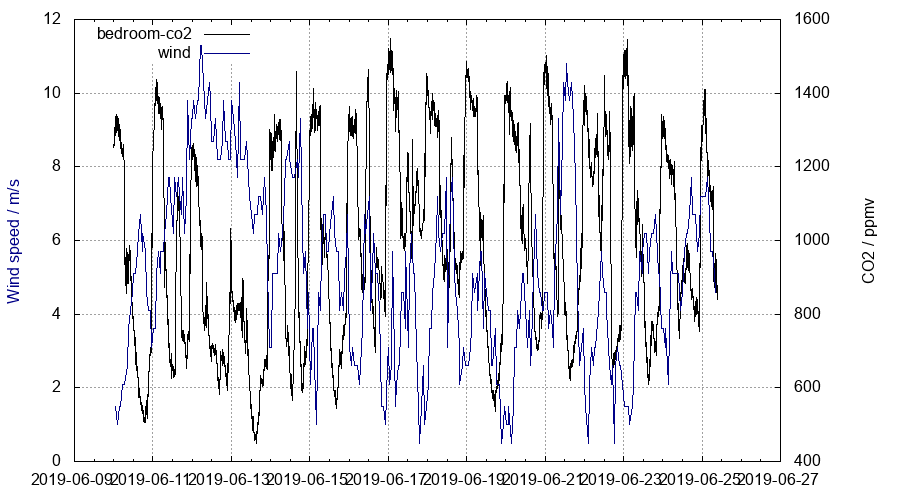
Bedroom CO₂ level (in the old house I'm staying in) and wind speed (at Wick airport, about 20 km away) for the last fortnight. I always leave the bedroom door ajar but otherwise make no effort to ventilate more than the house more than it does for itself. As you can see, roughly speaking the higher the wind speed the lower the overnight CO₂. I think with old houses if you didn't make a conscious effort to ventilate you at least got low CO₂ some of the time to recover, with a modern well-sealed home you probably don't get that much higher peak levels but you might well get them much more of the time which, it seems to me, might be more of a health issue.
-
My understanding: inches are the inside diameter (bore), mm are the outside diameter. E.g., ½" = 15mm. (15 - 12.7)/2 = 1.15mm wall thickness. Is that broadly right? No doubt there are weird exceptions.
-
VAT rise on PV systems coming
Ed Davies replied to MikeSharp01's topic in General Self Build & DIY Discussion
I'd be OK with 20% if they put it on all domestic energy. 20% on insulation and PV but 5% on mains gas and electricity is just perverse. -
Save the world, install an LPG tank.
Ed Davies replied to epsilonGreedy's topic in Environmental Building Politics
The point was that a) Heller's presentation of the raw data was flawed to start with so the rest of his article should be taken with a pinch of salt and b) that with just this simple correction the raw data doesn't disprove global warming anyway so his theory that the adjustments were added just to cover this up is not supported. As to your other points, and has already been said on this thread IIRC, if volcanoes, solar variation, human aerosol emissions and CO₂ are taken into account models get a fairly good match the last century or so's climate. If CO₂ is left out then it's impossible to get a good match, so no, the graph doesn't seem to disprove a link between CO₂ and global warming. -
Save the world, install an LPG tank.
Ed Davies replied to epsilonGreedy's topic in Environmental Building Politics
http://www.meteo.psu.edu/holocene/public_html/shared/research/ONLINE-PREPRINTS/Millennium/mbh99.pdf Figure 3 (a). I've no idea what your graph is showing but temperatures in the region of -30 °C are clearly more local than hemispheric or global. -
Save the world, install an LPG tank.
Ed Davies replied to epsilonGreedy's topic in Environmental Building Politics
Because if it melts it'll raise sea levels significantly. Because that's where the ice cores are (which are a good record of global climate if you pick the right data series). Yes, that's irritating when it's used as some sort of “proof” (which is more down to activists and journalists than scientists). Used as an illustration of the sort of effects expected it's sort of OK, though and combined with some pretty heavy statistics for attribution is quite reasonable. -
Save the world, install an LPG tank.
Ed Davies replied to epsilonGreedy's topic in Environmental Building Politics
Yes, but it's a bit more specific than that. It's the tactic widely used by evolution and climate change deniers, moon hoaxers and so on of asking “questions” but not engaging with the answer given, instead just changing the subject and bombarding the opposition with further irrelevant questions. -
Save the world, install an LPG tank.
Ed Davies replied to epsilonGreedy's topic in Environmental Building Politics
https://en.wikipedia.org/wiki/Gish_gallop -
Save the world, install an LPG tank.
Ed Davies replied to epsilonGreedy's topic in Environmental Building Politics
Adding to what I wrote above, it's worth pointing out that any corrections for urban development are exactly the sort of thing that Heller is complaining about in the first place. My purpose here is simply to show that the first step he took in looking at the unadjusted data was seriously flawed so it would be very misleading to apply any adjustments while doing that. -
Save the world, install an LPG tank.
Ed Davies replied to epsilonGreedy's topic in Environmental Building Politics
The hockey stick is seen over longer periods. IIRC the original Mann et al one was over 1000 years. The warming since the beginning of the industrial revolution is all part of the head (or whatever it's called) of the stick. -
Save the world, install an LPG tank.
Ed Davies replied to epsilonGreedy's topic in Environmental Building Politics
No, that isn't accepted. It's widely thought that emissions from the beginning of the industrial revolution have affected the climate. When climate models are run for the last hundred years or more they get a reasonable match the climate only if human CO₂ emissions are taken into account. Solar activity, volcanoes, etc, don't match well enough without CO₂. A respectable minority of climate scientists think that human activity prior to the industrial revolution also affected the climate via changes to CO₂: https://en.wikipedia.org/wiki/Early_anthropocene . I personally, without bothering to go look for reasonable sources don't happen to remember what the accepted view is on the subject, though as Steamy says it was probably pretty local. IIRC, though, there are reasonable theories on the subject. There wasn't one of any statistical significance. https://tamino.wordpress.com/2014/01/30/global-temperature-the-post-1998-surprise/ And just in case you think I'm uncritically accepting that, my slight tweak on the subject: http://localhost/2014/01/what-hiatus/ As above, dunno about the Roman warm period. The little ice age seems to have been caused by a combination of increased volcanic activity and low solar activity. No, I just used the data your “source” used. Not particularly, though looking in odd places for the answers might. When I used the word “crank” about Goddard I was particularly thinking of his notions that it's the pressure rather than the greenhouse effect that makes the surface of Venus so hot. This is so disconnected from well understood physics (or common sense) that it's difficult to know how to start arguing with it. -
Save the world, install an LPG tank.
Ed Davies replied to epsilonGreedy's topic in Environmental Building Politics
Reminded by a post in another thread to tidy up some code and partially answer the above. Because, with a little bit of contextual information they'll realise that your “apparently authoritative source” is (at best) an incompetent crank. As I mentioned in a post above, I strongly suspected that Heller/Goddard's data was just a simple average of the readings of the stations around the contiguous US. This is a very poor way of dealing with data from stations which are not evenly spread and come and go at different rates in different parts of the country. What I did was write a little Python script (cannibalising some code I'd already written to plot other data) to read the USHCN data and plot it as simple averages and then as area weighted averages. Since the dataset included the US State of each of the stations I simply used the states as the areas. The areas (in km²) of the states came from copy and pasting a table from Wikipedia (referenced in the code). In my graph the blue line should correspond very closely to Heller's blue line for the unadjusted data. The red line is the same but with area weighting. As you can see the area weighting considerably increases the apparent rate of warming over the 120 or so years involved. If you want to play with the code then remove the .txt filename extension added to bamboozle the forum software. Needs Python 3 and gnuplot. ./ushcn.py --help for command line options. The graph was produced with ./ushcn.py --width 900 --height 500 -s 1895 -O ushcn.png The next thing to do would be a similar exercise with the adjusted data to see how much difference area weighting made to that. Maybe one day. ushcn.py.txt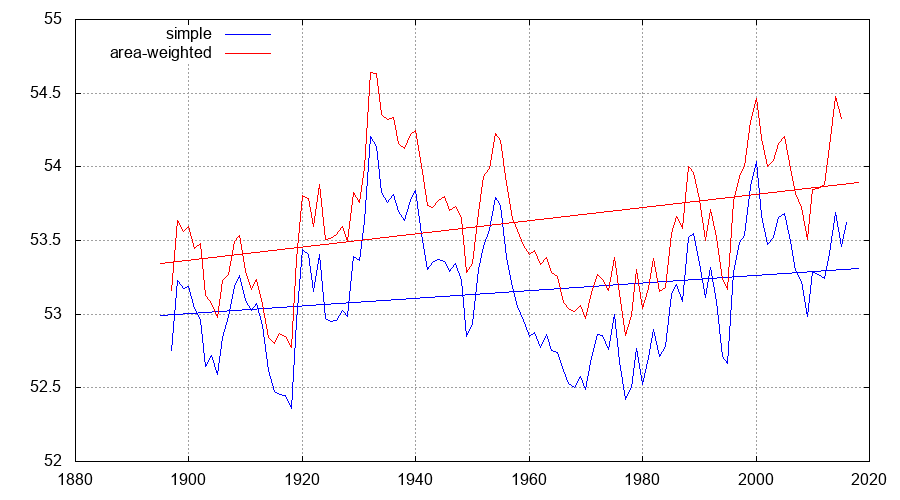
-
According to much of the mainstream science thinking I was following quite a few years ago [¹] it's clear that even if there is a grand solar minimum it'll only delay our current warming by a few years (a decade or two, maybe). I'm surprised [²] people are still trying this silly argument. [¹] http://www.realclimate.org/index.php/archives/2011/06/what-if-the-sun-went-into-a-new-grand-minimum/ is a good place to start. [²] No I'm not. Pissed off might be a better description.
-
I think it's a dreadful figure when comparing technologies because it's so dependent on the technology in use. E.g., any time you turn energy into heat and then try to use that heat for something else (e.g., a gas or nuclear power station or an internal combustion engine) you'll only finish up with about 30 to 40% of the input so the primary energy is some 2.5 times what you actually want. My somewhat sarcastic response in a similar discussion elsewhere was to say that a 20% efficient PV array producing 4 kW output has a primary energy of 20 kW so that's what we should compare against the primary energy of fossil fuels.
-
Reading measurements from a DWG file?
Ed Davies replied to Dreadnaught's topic in General Self Build & DIY Discussion
But how would you take accurate measurements off those? -
That David MacKay video starts with a major blunder which he alludes to but doesn't fully admit further on in the talk. He says UK energy consumption is 125 kWh/person/day (~ 5.2 kW/person). This must by the primary energy consumption as final energy consumption is a lot lower, I make it an average of about 2.8 kW/person for the EU28 (https://edavies.me.uk/2018/01/primary-final/). Primary energy is the energy contained in all of the fuel burned. Final energy is the energy people get to use. Actually, it tends to be the energy delivered to the end user. E.g., for petrol used in cars it's, I believe, the energy contained in the fuel as it's delivered at the filling station so includes the waste heat that goes out of the car's radiator and exhaust pipe. For gas for domestic heating it's the energy in the gas as it goes through the meter so includes the waste heat that goes out the flue. So actual energy use per capita is even lower. Wind turbines and solar panels don't have to generate the power which goes up power station cooling towers or out of car exhaust pipes.
-
Yep, it can be very difficult to visualize. When I was designing my house layout I came up with a bathroom size and decided to check if it was too small by comparing it with my then-current house's small bathroom. Found the current bathroom could fit in the proposed one diagonally - so, no, not too small. One thing you could do is to compare it with the minimum standards in building regulations for accessible facilities, in Scotland start with 3.12.3 in https://www.gov.scot/publications/building-standards-2017-domestic/3-environment/312-sanitary-facilities/
-
But there isn't a clear distinction between generation/storage on one side and demand on the other. Slabs, thermal stores and car batteries would be a significant part of the total storage in the system so there would still be a need to send a price signal to influence when they're charged. Smart metering would still make sense, just with less wild swings than are sometimes seen in current wholesale markets (negative prices, etc).
-
Just got my EPC figures
Ed Davies replied to joe90's topic in Energy Efficient & Sustainable Design Concepts
That really would be massive. I hope you mean 2 kWh/day which is 1/24th as much. -
Irrespectively? I doubt it really matters but…
-
The eyes have it, the eyes have it!
Ed Davies replied to ToughButterCup's topic in Project & Site Management
Closely related: I wear safety glasses pretty much all the time I'm working. Three reasons: eye safety (duh!) but also they're bifocal and I really need them for any sort of close-up work and they also help with avoiding my eyes drying out. The problem I have is them misting up as soon as I do anything which takes a bit of effort or if I get angry about anything. Any suggestions for sprays or whatever to prevent that?