
SteamyTea
-
Posts
23694 -
Joined
-
Days Won
198
Everything posted by SteamyTea
-

Flat roof top coat EPDM, GRP, Liquid Polyurethane?
SteamyTea replied to Warrentdo's topic in Flat Roofs
Could be a problem for any material. There are flexible polyester resins, and with a suitable orientated weave, expansion joints could be made. I am willing to work as your consultant about all stuff GRP. -
Solar Quote
SteamyTea replied to bob the builder 2's topic in Environmental Materials & Construction Methods
That is because of the testing methodology, they have have been tested for output with an input of 1000W.m-2, at 25°C, which would be the point that they deliver at least the stated output. They may well have produced 10% more for during the test. Modules that just fail the STC would be relabelled to a lower output i.e. failed at 330 Wp, relabel as 310 Wp. Even of they are just 1 Wp below the level. So the trick is to not buy the highest output modules, but the ones below, if there is a decent enough price difference. If you find a local weather station that has a W.m-2 sensor on it (kWh/day is no use here), you can take a random selection of dates, but pick the same 3 times each day i.e. 10 AM, 2 PM and 4PM, then correlate the output of your system to the irradiation levels, then see how the performance has changed over the years. You can even adjust for different ambient temperature. -
While filling the bath, the shower pump seemed starved of water. Shut the taps, bathed, got up in loft and the cold tank is not refilling. Shut off water, removed ballcock and valve. The little white plastic cone that has a hole in the middle has a small screw in it. The same screw I dropped down a pipe when changing the cylinder a few years ago. Ten minutes, problem sorted.

-
- 2
-

-
Solar Quote
SteamyTea replied to bob the builder 2's topic in Environmental Materials & Construction Methods
That is 87% of the stated peak power output of the module at standard testing, which is not the same as as what they actually tested at when new. That makes it very possible that over a decade you will see a quite large drop off in performance of the total system. -
Similar to the energy I saved last month by fixing a door and fitting secondary glazing.
-
Just remembered that I have in the past used these header pins that don't require soldering. https://shop.pimoroni.com/products/gpio-hammer-header?variant=35643318026
-
Can get a SPI card reader for the ESP2866, so would assume there is one for a 32. I do like off the shelf stuff, Lego mentality.
-
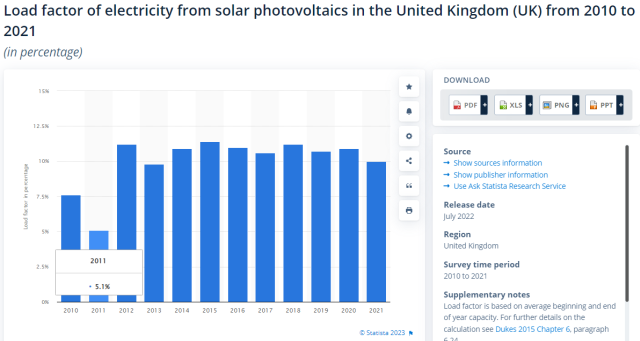
As long as we don't have a year like 2011. Capacity Factor was halved. https://www.statista.com/statistics/555697/solar-electricity-load-factor-uk/
-
Spring moves a about 1.5 MPH. But it travels in a SW to NE direction. So that makes you about 45 miles away, in time. So should only be a day and a bit later (30 hours).
-
My experience with RPi ZW is that some are very reliable, and others are just hopeless, so could it be replaced with a ESP2866/32 or whatever the latest incarnation is, then it is not relying on all the other stuff the operating system is trying to do. The ones I have already have a analogy to digit converter built in, as well as wireless/bluetooth. Easier to load an 'image' onto as well, no need to much about with TTL. Possibly require an easy way to connect it to a network, push button maybe? Sell that bit, but with the option to DIY it as well.
-
You got any of these blooming?

-
Depends how much you pay for water and waste really. You can get inline heaters think @joe90 had one and sold it to someone on here.
-
Don't let the new packaging fool you.
-
You can get melamine faced ply. Same stuff that is used to create shower rooms. Some is able to be clipped together with the joint hardly showing. But pricey, but after filling the nail/screw heads, would give a better finish that plastering. Would think it is fairly fire resistant as well. Never seen a kitchen worktop slight.
-
Get one from Penzance Hospital, it has been up my arse. Always nice to have a personal connection to other members.
-
Yes, I don't think it is excessive. I assume you have scaffolding up, if so, that is quite a saving.
-
Back in November 2019, installed PV in the UK was, on average, £1465/kWp on a typical 4 kWp system. March 2022 it had risen to £2000/kWp. https://www.statista.com/statistics/499507/average-solar-pv-cost-per-kw-installed-uk/ The only way is to get quotes from installers. Realistically the only information you can get from web searching is component parts.
-
Smoke problem from neighbours
SteamyTea replied to Savage87's topic in Mechanical Ventilation with Heat Recovery (MVHR)
Yes, but you are talking about Organic Chemistry, not Non Organic Chemistry. Activated charcoal is made to absorb other carbon based molecules, so it will work for that. -
Smoke problem from neighbours
SteamyTea replied to Savage87's topic in Mechanical Ventilation with Heat Recovery (MVHR)
The term 'filtration' may be misused when it comes to NOX. It is more usual to use a catalyst. Ammonia (a wonder chemical) is often used to strip the oxygen off the molecule, called selective catalyst reduction, SRC. I don't think a physical filter is going to make any difference. -
"Modern" radiator design and controls?
SteamyTea replied to mjsx's topic in Central Heating (Radiators)
Have you done a room by room heat loss calculation to correctly size the radiators to the expected load. Get that bit right and you do not have to bother with individual room controls. -
Using a PV energy diverter to heat a hot water tank.
SteamyTea replied to Marvin's topic in Electrics - Other
Back in the 1960's and 1970's it was not unusual to buy electronic kits for home assembly. I wonder how many half fished Sinclair amps and calculators there are in Grandad's lofts. -
Western Power are now know as National Grid. I don't know why.
-
Chart Time: Hourly Temperature decay and power inputs.
SteamyTea commented on SteamyTea's blog entry in Energy Ideas
Yes, apart from the weather, that is the only change. I now use almost a quarter of the energy I used when I first moved in. Off Grid is a reality, with a small CHP unit. I need a use for my car engine when the suspension fails. -
I have Blogged my update. https://forum.buildhub.org.uk/blogs/entry/972-chart-time-hourly-temperature-decay-and-power-inputs/
-
Chart Time: Hourly Temperature decay and power inputs.
SteamyTea posted a blog entry in Energy Ideas
Prompted by @haddock's query here: and my few charts to show what has happened in my house, I have finally got all my data together and after looking at dozens of charts, have reduced it to two that show the most useful information about my house cooling, or heating. Initially thinking that the difference between internal and external temperatures was the best base to chart against, I soon realised that it shows hard to understand results i.e. a larger number, the colder it is. Then it struck me that as I was looking at the slope of the data points for °C/hour change in internal temperature, temperature difference was built in i.e. colder outside, the faster the house cools. Real scientists would be talking about 'energy forcing' which cover all energy inputs because of the Conservation of Energy: Energy cannot be created, only change its form. But enough of that, the rest is statistics. Without going into too much detail about data error checking, rounding and discarding data, the data points for the last 4 years were reduced to about 500,000 from about 300,000,000. Or basically data collected every 6 seconds reduced to data for every hour. The data eventually used was Year, Month, Hour, External Temperature, Internal Temperature, Power and Zero Power. Other fields were created i.e. Week Number and Maximum Power, but these remain unused at the moment. From that data it was quite easy to create hourly temperature slopes [°C/h], just take the last hours temperature away from the current hours temperature. If it is positive, it has got warmer, negative, colder. Power data was averaged (mean) over each hour. If there was an error because of missing data, or misreported data, then that was filtered out and will show up in a lower data point count but can be corrected with the Standard Error of the Mean. This left 139,165 usable data point out of 140,268, not perfect, but quite usable. There was one other set of derived data that was discarded, and this was extreme temperature slope values. Generally, the majority of the data points for the temperature slope was between -0.4°C/h and 0.4°C/h. Occasionally a slope that was into the major integers appeared. Now it is very possible to get cooling of 2°C/hour by leaving the window open, similarly a large increase in room temperature could be caused by letting a cake cool under the temperature data collector (I actually did this and wondered why the room temperature was reported as 27°C, in November). This data was therefore filtered to exclude anything outside of the range of >=-0.5°C/h and <=0.5°C/h. Again, this can be justified as the Sample Count and the Standard Error can be used to adjust the results. Other descriptive statistics were used to help explain what is happening. Minimums, Maximums, Standard Deviation, Skew and Slope were calculated on the relevant data ranges. External Temperature Distribution, as a percentage, was calculated as a Normal Distribution as well as empirically from the data. This was done as a data check but also highlights the variations in the temperatures and the associated skew i.e. long tail to the left [negative skew], the modelled data shows no skew. Now that the dull bit is over, some charts. The first chart is all months and all hours for the years 2019, 2020, 2021 and 2022. As expected, the mean slope, the actual change in rate of the house warming up and cooling down, is very close to 0°C/h. It also shows that at very low external temperatures, the house cools faster i.e. -0.3°C/hour when it is -3°C outside. Around the mean external temperature of 12°C there is house cooling of -0.06°C/h, which is basically no change. The house does not start to warm up, until the external temperature is 23°C, but as the Temperature Distributions show, that does not happen very often down here in Cornwall, less than 1% of the time after rounding. This does not mean that the house does not get hot, at one stage, it was at 29.43°C, a proper temperature and one I can easily get used. Taking the internal temperature standard deviation into account, 90% of the time, the house temperature is 20°C ±4°C. Lower temperatures were probably when I was away, higher temperatures were probably during the two severe heat warnings we have had down here. Power usage, which is a bit peculiar in a house with storage heaters, often show a warmer temperature in the mornings and it being cooler in the evenings. As the data can be filtered by hour, the next three charts will show all times over the last four years, then after the heating has finished during the first two months of the year, up to near enough local noon, then local 14:00 to 19:00. The x-axis is Internal Temperature Slope, the °C/h. The above chart shows that as the internal temperature change reduces, less overall energy is needed to keep the house a a stable temperature. This is backed up by the times the house is using Zero Energy. The Zero Power outlier on the left corresponds with an almost zero energy usage, and a greater temperature drop of just over -0.3°C/h, so the house was probably empty then. The 7AM up to 1PM [6 hours] chart during January and February which are known heating months. This shows a very different picture. The mean power is now 0.1 kW [100W], down from 0.5 kW [500W] because there is no heating input, but the house is hardly changing in temperature with most of the data points clustered between -0.02 to 0.05°C/h. The outliers on the right are probably oven usage. The 2PM to 7PM [6 hours] chart for the same period. As the storage heaters have now not been recharged for at least 8 Hours and up to 14 hours, it is unsurprising that the house is starting to cool a bit more, with the energy inputs stretched out a bit more between -0.28 to 0.2°C/h, clustering between -0.18 to 0.07°C/h. This is highlighted better on the next two charts which cover the same time periods. 7AM to 1PM [6 hours] chart. As the temperature slope is negative, it shows that the house is cooling at a rate of -0.003°C/h, which is basically stable and shows that the storage heaters are keeping the place warm, 19.8°C, with a greater warming affect the colder the outside temperature is. The 2PM to 7PM [6 hours] chart As mentioned above, because the storage heaters have not been charged up for many hours [between 8 and 14 hours], it is not a surprise that the house is cooling. What is a surprise is that the relative cooling is so low at 0.015°C/h. Part of this will be because the internal temperature has risen slightly to 20°C [my target temperature]. Allowing for the increase in the Standard Deviation of 1.32°C, up from 1.29°C in the morning, there is, in reality, no temperature change, and certainty not one that is noticeable. Now that is all over, I am going to show four charts that highlight what adding secondary glazing and fixing the leaky back door have done. These are for December. The first two are the temperature slope, second two are the power usage. December 2019, 2020, 2021 Temperature Slope chart. December 2022 Temperature Slope chart. Pre improvements was cooler in the house even though the mean external temperature was 8.3°C as opposed to 5.8°C in December 2022. The range of temperatures where much greater as well in December 2022. December 2019, 2020, 2021 Power Usage chart. December 2022 Power Usage chart. Mean power is now 0.85 kW, down from 1.28kW, a reduction of 0.43 kW or 320 kWh for the month. The slope, on these power charts, shows the change in power needed for every °C change in external temperature. That has gone from 100W/°C to 60W/°C. Airtightness and insulation really work, and I am still getting the benefit of those improvements.