Jump to content
  • entries
    24
  • comments
    246
  • views
    12798

Update on Energy Use Based on 4 years of Actuals


TerryE

2752 views

 As I have discussed on earlier podcasts and various topics, I have a Willis-based configuration for heating our low energy house, and control is implemented with a dedicated Raspberry Pi using a custom NodeRED application for our underfloor heating and SunAMP-based hot water.  This system logs a lot of instrumentation temperatures every half hour and also any significant events such as turning on and off pumps and the heater.


Our electricity supplier has been OVO for the last 4 years, and because we have a smart meter, the control application also includes a script to log on to the OVO Portal and download the daily usage data into the MySQL database.


Because these latest energy hikes, we have decided to revisit the issue of whether it would now be cost-effective to install an ASHP in order to save on monthly electricity costs for heating.  Because I have been logging all relevant data for the past 4 years, I can base this decision on hard actuals rather than some generic planning assumptions. The next two graphs summarise these results.  The first is an analysis of our daily energy use (we have an electricity only house).  What I have done here is to aggregate the 4 years of data by calendar month and split these into three categories: 

  • Underfloor Heating (34%  or ~4,000 kWh/yr).  In practice, we only heat off-peak and use the thermal mass of the floor slab and the house itself to smooth out the overall background heat levels.  As I have discussed in other topics, this results in a temperature ripple of about 1°C which is quite acceptable given the reduction in overall all heating costs.
     
  • Other Off-peak use (25% or ~2,900 kWh/yr).  We also use a couple of small oil-filled electric heaters on the first and second floors for the 4 cold winter months.  These output roughly 1 kWh and run on a timer (actually controlled by my home automation system).  We find that 3 or 4 hours is typically enough to keep the upstairs acceptably warm in the coldest month; this also means that the UFH on-time doesn't need to run over into peak periods. Our resistive load white goods (the washing machine, dishwasher, SunAmp DHW) are timed to come on in the off-peak period. 
     
  • General Peak Rate use (39% or ~4,500 kWh/yr). Pretty much all of our baseload and direct hands-on devices: fridges, freezers, cooking, computers lighting, etc.

Note that the 2 retired (out of the 3) occupants of the house spend most of May, June, September, October abroad; hence the dip in this general use figure.  I find the annual variation on this base load a little intriguing ,and I am not sure why it is so high.  Our live-in son often has his radiator on in the evenings when he's at home, and we do spend more time indoors in the cold dark months.

1174027032_DailyElectricityUse(kWh).png.9fddf57172b5a236322dcf8b13a2ce2d.png784369419_AnnualElectricity(kWh).png.c948d863703e26666b779eee417d10c0.png

The simplest ASHP implementation would be for slab heating only and would give a CoP of ~4 (as the circulation temperature is under 35°C) hence saving perhaps 3 mWh p.a. @ 18.86p/kWh or roughly ~£560 p.a. at our currently quoted OVO night rate.  Given that we would need to use an MCS certified installer to exploit a permitted development waiver, I would expect our installation to be £10K or higher, so I still don't have a viable cost benefit case to go this route.  Yes, adding pre-heat for the SunAmps would increase this annual saving, but this would complicate the installation, and given our volume of DHW use this would in fact worsen the cost benefit case rather than improve it.


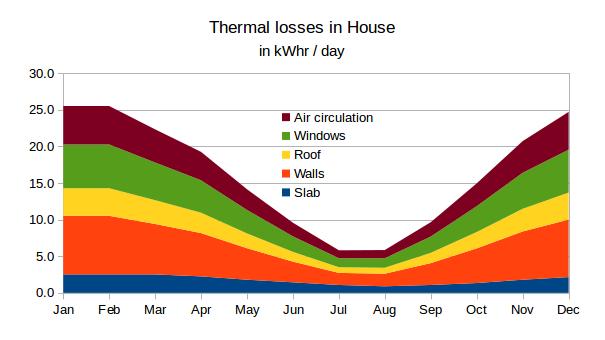
Another interesting point is raised by the following graph which I pulled from a 2014 Thermal Design post. The bottom line is that thanks to entropy, pretty much all of the electrical energy that we use ultimately ends up as heat within the fabric and airspace of the house. Given this, the overall heat losses (if you take December for example) are pretty much double what we originally estimated.  The following can account for the majority of variance, but not all.

  • We had to drop the U-value for the warm roof to minimise ridgeline heights keep the planners happy
  • We added 60° reveals to our fenestration to improve overall light levels given the planners putting hard limits on our window sizes, and these some limited thermal bridging
  • Winter solar gain is almost non-existent for our window configurations.
  • As discussed in an earlier post, we had a cock-up in our slab design which created a thermal bridge between the inner ring beam (this supports the frame) and the outer ring beam (supporting the stone skin).  We could only partially mitigate this during slab pour.
  • We estimated that MVHR would have a recovery efficiency of around 90%, but looking at the inlet temp vs room, I estimate the actual recovery is nearer to 80%, that is double the heat loss.
  • We run the internal room temperatures a couple of degrees warmer than initially planned.

However the house is built and well established so getting any convergence is now unlikely.  So the house performs as a low-energy one, rather than a true zero-energy one.  And we still only put ~20kWh into our slab in the coldest months.

4ParkRd-HeatLosses.jpg.ee7f0e5bd493f7b98


Edited by TerryE

  • Like 9

26 Comments


Recommended Comments


It's a fascinating subject that can take a lot of time to understand fully.  I have still not got to the bottom of why our "non heating and non DHW heating" use exceeds the heating use, and like you it goes up in winter when logically that can only be more use of the (all LED) lighting.


Is it worth a planning application for an ASHP so you can DIY install one?  Or just do it and hope nobody bothers?

Link to comment

Have you done a HDD test?

I have recently posted up a load of charts that take wind direction, speed, temperatures, solar power (not PV) and energy usage.

Cant really tell what is happening except if the external air is warmer, the house is warmer.


33 minutes ago, ProDave said:

I have still not got to the bottom of why our "non heating and non DHW heating" use exceeds the heating use

Is that because you have a wood burner?

Link to comment

@ProDave,  Accredited Installer route or not, we would still need to comply with the noise requirements complete with calculation sheets. We would need a BInsp to sign off on this and the danger that the assigned BInsp might just demand an accredited installer do the worksheet. Plus all of the fees of course.   Also since the ASHP would only be 1.2m from our boundary fence and 7m away from the neighbour's nearest opening fenestration, we would need a quiet ASHP such as the Ecodan 5kW.  This with the controller comes in at around £4½K.


But another is that our house (even with the poorer as-built performance) is still factors out the operating regime and templates that most ASHP units and installers are used to.  We need the equivalent of 1kW continuous heat at somewhere between 30-35 °C (max) into the slab during the coldest months (or say 8×3 kW if we want to use mostly E7 low rates).  It is a huge thermal store and so will soak this up happily.   My algo for this is quite simple: set the O/P flow temp to something sensible, say 32°C if can be set that low, though putting a decent PHE between the ASHP and the UFL circuits might simplify this gearing; turn on the ASHP demand; integrate up the delT out-return on the UFL to calc the heat dumped into the slab and turn off when the desired total kWh reached.


Need to think more about the peak variation causes, but I'll reply separately on that.

Link to comment

Your peak usage is a bit surprising to me. We use roughly the same amount over a year but both peak and off-peak, with gas CH and HW. There are four of us and my wife and I still WFH at least three days a week, I have my desktop on for 12-14 hours a day with 2*27'' monitors. Your house is of course larger, may be it's the lighting required for large spaces, not sure. We mostly cook in the electric oven and run the washing machine, drier and the dishwasher. 

A server farm? 🙂

Link to comment
On 29/10/2022 at 15:10, oldkettle said:

Your peak usage is a bit surprising to me.

It surprised me too. 🤣  Jan and I are retired.  My son is only working a part week ATM, so we are in the house pretty much all of the time and my son effectively has his own bed-sit on the top floor.  So we have 1 freezer (plus a small supplemental one brought on when needed);  three fridges; 1 DW, 1 WM; our cooking is electric / induction; SunAmps for HW; MVHR and slab recirc; 1 gamer PC and 2 laptops on; tablets and mobiles of course, and 3RPis.  All lighting is LED.  The fridge/freezer in the utility is old, so it has a relatively poor energy rating, but it is not economically worth replacing.   It seems quite easy to sustain 600-750W baseload for this lot, and that equates to 15-18 kWh /day. 😢

Edited by TerryE
  • Like 1
Link to comment

A note to say that I appreciate the gentle, but long-term, reflection that @TerryE has put into this blog.


Cheers - just re-read all of it.

Link to comment

@TerryE  Really interesting Terry. I've been collected limited data for our build and have 5 years worth.  Our heating input requirement, sits between 6500 and 7000 kWh per annum, so very close to you.   We solely provide this via UFH, the heat source being our ASHP. Input energy required sits between  1850 and 2000 kWh per annum, the variation being down to difference year to year in weather.  Our domestic electricity use (everything other than heating and hot water via the ASHP sits at 4000 kWh annually, albeit I can already see this reducing now our children are away and games consoles are not being played all evening).  Our heating requirement is a little higher than I modelled, but not significantly so, and given the year to year variation in heating requirement, perhaps margin of error territory.  We have up until now run our house with the master thermostat set to 21C, although in reality the house sits at 21.5C  As an experiment, I've reduced the temp down to 19C to see how we get on and whether we are comfortable through winter. So far so good, and it's certainly very comfortable when you wear a jumper. Early indications indicate this change would halve our heating requirement.


Link to comment

I've only been collecting external temperature data for the last three years, so I have been using this plus daily peak + off-peak values to examine correlations between these. 


OVO has recently updated its logging query API, so I have updated my data pull NodeRED routines and have repulled the data from my last 4 years of fixed-price E7 usage, daily actual meter readings (which is what is used for billing), and the reported daily and ½ hourly usage.  (The old API reported usage incorrectly, basically because the dual tariff is based on 0-7 AM UTC for off-peak and a 0:00 UTC split on daily billing, but the OVO portal uses UK timezone for reporting and the current version still botches the hour to 1AM during daylight savings.)  However this is only a reporting issue and not a financial one, since this bug doesn't impact meter reading actuals.


Returning to the data, the strongest trend is shown by the external temp vs daily total power use scatter plot, which fits to P = 60 - 2.45T, that is each drop of 1 °C in average daily outside temperature requires an extra 2.45 kWh heating.  I also checked this against my pre-build design calcs which predicted 1.92 kWh, i.e. the as-built house performs about 25-30% worse than as-designed. (See my original post for the likely reasons for this off-nominal performance).   Maybe disappointing, but still factors better than a typical new build.


Realistically, given that we have an electricity-only home, I can do little to change this line.  As I have said, I can't make the investment case for installing an ASHP at the moment so I have to live with a CoP of 1.  The main behavioural handle that I have would be to drop average house temperatures a degree or two.  The other handle that I have is to control the unit price that I pay for my heating, this is by absolutely maximising off-peak use, and have a blitz on avoidable peak rate use, but I will do a separate post on my plans here.


Edited by TerryE
  • Like 1
Link to comment

Interesting figures, I recently looked at this on our house with 13 months of DCC smart meter data compared against heating degree days from a local weather station (https://www.degreedays.net/). Regression fit for input kWh to degree days, input both with and without hot water (some energy lost to the drain). Came out somewhere between 4.1 and 4.7 kWh/hdd. This is a mid 90's house with some insulation everywhere, but nowhere near modern standard and poor airtightness. It'd be interesting to get a range of figures from different types of housing.


Also, the point of me doing this is that you can use the average forecast temperature for the following day to work out how many kWh heating will be required the following day, allowing a PV divert to power a heater without over-heating the house. I'm yet to get this set up and am unlikely to bother until export rates drop as my heating is still mains gas.

  • Like 1
Link to comment

@S2D2, I don't want to segue into the next blogpost that I am drafting, but thanks for your comments.  Our first house was a 1920s mid terrace, so we had effectively zero heat losses through the party walls.  What we've got now is a 3-storey detached house.  The bar or baseline is very different for different house geometries. I have also been pondering this old entropy lark: how much of our energy input doesn't end up in adding to the fabric heating> The answer is two shades of bugger all.  For example, our DHW waste outflow does run out of this environment representing a partial direct heat loss, but this is relatively small as we dont use that much HW, and as our pipe runs flow through the warmslab before dropping into the waste flow under it; so 10s of ltr per day @ maybe an average of perhaps 30°C.  Radiative losses are small with our windows, but quite honestly on the other hand our solar gains are bugger-all on our net heating days for our house aspect and window geometry.


Pretty much everything else eventually heats the house fabric.

Link to comment

COP for flow temperatures 35C or below will be over 4 for any reasonable unit.


You don't need to MCS heat pumps. You can just slam one in independently and rely on no objections within 4 years to make it defacto permitted. Even fancy ones are well under £5k in the (tiny) size that you'd need.


1000 Vs 4000 kWh/yr. Plus all 4000 kWh on-peak usage moves from silly rate to standard rate. Plus those oil filled radiators die. I wager they're at least 2000 kWh/yr.


Night use seems silly high unless that's the direct electric hot water. I've also got a lodger - an IT type with a server that eats 1.2 kWh/day plus a daft desktop PC, and I WFH with many work gadgets running 24/7 plus two fridge freezers (1.2-1.5 kWh per day the pair) and MVHR (0.7 kWh/day) and we just about hit 5 kWh/day (so perhaps 2 overnight rate) with nobody home.


Energy monitoring plug time perhaps; to find out what those oil filled rads are really eating?


  • Like 1
Link to comment

>>> Pretty much everything else eventually heats the house fabric.


Yeah, agree.


Thanks for the very useful analysis and stats. 11.4 MWh p.a. does sound high. What's the floor area? Since you're obviously a fellow technologist - maybe time for a circuit monitoring set-up?

  • Like 1
Link to comment
10 hours ago, Alan Ambrose said:

11.4 MWh p.a. does sound high.

Our total energy actual use for this closing year is 10.9 MWh.  All electric, green tariff.  That's for a reasonably large detached house with 3 bedrooms (2 with en-suite) and a bathroom on the first floor and my son's bedsit on the 2nd floor.   Total internal floorspace around 170m2, IIRC.  We are retired so live in the house pretty much 24×7.  


Apart from heating,  and normal whitegoods / cooking, the biggest chunk of our base-load is my son's gamer PC and his two 60+in screens. 🤣


As I said in my OP, adding an ASHP could drop this by up to 3mWh, but I can't make the RoI case when I crank the numbers.  Food, booze, rates and electricity costs are about our only major outgoings, with no other maintenance or depreciation to speak of, because we designed the house with zero-maintenance in mind.  Unlike the Willis which is a long life resistive heater, an ASHP has a typical life of perhaps 10 years, and well as needing annual maintenance.

Edited by TerryE
Link to comment

Hi @TerryE


We have also been looking at energy use figures and its quite interesting comparing how homes work. Our bungalow floor area is 104m2.


I monitored the outside temperature hourly using our weather station and compared the results with the local weather station which is only 1 mile away, and sure enough the temperature records were the same so now I just use their data.


We measured the daily power demand for as many appliance as possible in our home and keep daily records from when the ASHP was installed. Our average over a day, lowest background power use, is about 300W continual


We have east and west facing windows and this gives major solar gain - even during winter on bright days. Our total energy purchased in a year will be about 3400kWh and PV production about 6600kWh so 10k potential.

The ASHP uses about 1840kWh a year.

The car uses about 640kWh a year


These we measured:

The MVHR uses about 262kWh a year

The fridge freezer uses about  120W an hour or about 1000kWh a year

The freezer uses about 550kWh a year. 

The sky box uses about 280kWh a year

The router uses about 130kWh a year. 


So minimum energy used 2,200kWh a year!


Here's a useful link for those who wondered what household item uses what power:

https://www.electricalsafetyfirst.org.uk/guidance/safety-around-the-home/home-appliances-ratings/?gclid=CjwKCAiA2L-dBhACEiwAu8Q9YGohisCTL8TQ-HJ_pPVFchK3PdnWzEwFaSzpcjK6f0lcE7iBMI3GPhoCOxIQAvD_BwE


Also the more cooking and laundry done in a day the less heating seems to be required!


During the winter the the daily non heating use increases but not between 10pm and 8 am so this has to do with equipment use. I noted that the fridge/freezer uses less energy during the winter! 


Marvin


Edited by Marvin
  • Like 1
Link to comment
9 minutes ago, SteamyTea said:

Seems high.


As recorded


Item Low High Typical average per hour kWh used total hours kW per hour 24 hours
Fridge freezer 0.050 0.506 0.1 0.130 25.64 197.50 0.130 3.116
Freezer 0.002 0.293 one or other 0.070 1.71 28.25 0.061 1.453


Both are auto defrost....


Edited by Marvin
Link to comment
1 hour ago, Marvin said:

Fridge freezer 0.050 0.506 0.1 0.130 25.64 197.50 0.130 3.116

This does seem high, but perhaps it's just a big one or some things were added to be frozen? The sample size is small so could be affected by something like that. I don't monitor mine directly but smart meter data shows it has a background usage of around 365kWh/year. Add a bit for things being put in, door opening etc. Also if you're using a smart plug to monitor I found mine on a dehumidifier was overestimating by 20%, which may go part of the way to explaining it.

  • Thanks 1
Link to comment

We have a ~10 year old fridge freezer and a small top-up freezer in the utility, and a large larder fridge in the kitchen.  We only commission the small freezer as and when we run out of capacity in the freeze half of the fridge freezer.  The fridge freezer has the largest consumption of the three, but that's because it is old.  We can't justify replacing it because it is cheaper to accept the slight inefficiency, than pay for a replacement. 


By way of comparison, our base load is around 150W, and this is for:

  • 4×Asus mesh routers, 3 × RPi, 1 × Laptop; all at near idle.
  • the 3 fridge / freezers when always closed
  • the MVHR
  • the slab circulation pump on a 10% duty cycle.

So this is a few factors lower than your numbers.  I am not sure why.  This is an aggregate as measured by my Smart Meter and as billed by Ovo, rather than using a smart plug to estimate individual device use.  

  • My son's computer and TV kit when on adds around 70W on idle and 200W in use (most of the day 🤣).  
  • Opening and closing the chiller appliances, kettles and induction hob can easily add another 150 - 200W average during waking hours.  Kettles and microwave are high load, short duration.  Using the oven for cooking and baking causes a noticeable peak on measured use.  

We don't have a TV or media centre as we do all of our viewing on a tablet or Chromebook.   All of our space and DHW heating, and machine washing are scheduled during the off-peak window.

Edited by TerryE
Link to comment
4 hours ago, SteamyTea said:

@Radian's new fridge uses even less.


Since we came out of summer and keep the kitchen at around 19oC it uses even less, just 7W on average. Even the freezers are doing sort of OK at 77W for the pair. Considering that the old fridge was averaging 70W costing £200/year to run and this one is one-tenth of that, it will have paid for itself in less than 5 years.

Link to comment

@Marvin


I think you need a new fridge.  I noticed my old one had gone faulty because it was using about 3 kWh/day.

A very cheap energy upgrade.

  • Thanks 1
Link to comment

I can't believe folks even consider keeping shite old fridge freezers. Super easy swap and super easy RoI calc.


Then again I can't believe firms are allowed to sell shite new fridge freezers either.


Local box box store has these two, side by side, with a calc to show that the nicer one uses >4000 kWh less over its lifetime (>€1000) and is therefore worth the extra.


Fine - but the price premium being applied is outrageous and why the heck are they even allowed to sell the shite ones still?


https://www.senukai.lt/p/saldytuvas-samsung-bespoke-rb38a7b4eb1-ef-saldiklis-apacioje/h3fs 


https://www.senukai.lt/p/saldytuvas-samsung-rb38c7b6ab1-ef-saldiklis-apacioje/nite


Link to comment
2 hours ago, markocosic said:

why the heck are they even allowed to sell the shite ones still

Fridge/freezer energy performance was a rolling scale, so what was lowest 4 years ago drops of the scale and is replaced by what was middling, the best rating got even better.

So todays Es and Fs are better than 4 years ago B and Cs.

Link to comment
29 minutes ago, markocosic said:

But why allow the newly released 250+ kWh/yr units at all whilst it's eminently viable to produce sub 125 kWh/yr units?

Basically because there is a cost in producing a lower energy fridge, it may not seem much to us to put in a bit more insulation and change the compressor type to work with a different pressure refrigerant gas, but to the companies that have to to develop, engineer, produce, market, distribute and warrantee them, that cost is millions.  To raise that investment, they have to have something to sell, and that is the older, proven designs.

That is how mature businesses work.

Link to comment

Create an account or sign in to comment

You need to be a member in order to leave a comment

Create an account

Sign up for a new account in our community. It's easy!

Register a new account

Sign in

Already have an account? Sign in here.

Sign In Now
×
×
  • Create New...