Off Grid Thoughts
Off Grid Challenges
Recently, there has been a few people talking about off grid living. This is an admirable and romantic idea, and something I would like to do myself.
Then reality kicks in.
First we must agree what we mean by off grid. To me it means not connected to main services, but usage of public services i.e. roads, domestic rubbish, healthcare, education, policing, food, clothing etc is allowed.
Basically it comes down to water, waste and power. I have come to these limitations because I cannot live without the others. No one want to see me in handmade clothes and washed only in spring water.
So the first thing to look at is how much energy I actually use, and when I use it.
Luckily I take a keen interest in this and log my electrical data every few seconds (a mean of 8.5 seconds). Internal temperature data is also logged.
Initially, to keep things simple, I work with monthly data, but will drop down to weekly, daily and half hourly data when needed.
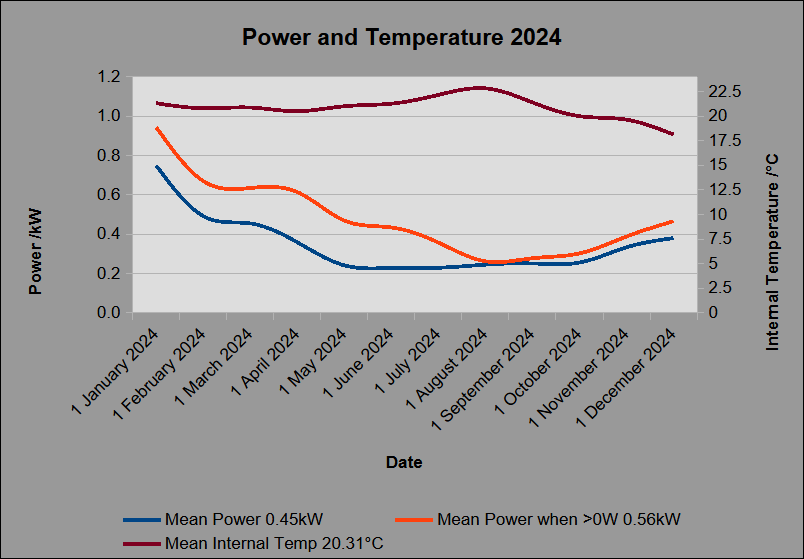
The chart below is the big picture of what I use.

Chart 1
I am generally quite happy with my overall usage and internal temperature. This winter I am experimenting a bit with the temperature as my working hours have changed after 15 years of working evenings I have gone back to working days.
As Chart 1 shows, January to April shows I have my storage heaters on and use a Mean Power of between 0.7 kW and 0.4 kW, then it drops to 0.36 kW in March, then down to 0.25 kW until the end of October.
As you will have noticed, there are two Mean Power lines. One is the ‘normal’ interpretation of the Mean i.e. the sum of all readings, divided by the number of readings. This obviously includes the minimum readings, which are 0 kW and sustained maximum 4.33 kW. ‘Sustained’ in this instance means for at least half an hour. There are times where the Maximum Power peaks at 13.16 kW when looking at half hour data, but this may be for just a few seconds or minutes.
By filtering out the 0 kW times, one gets a more realistic idea of what is actually being drawn and when it happens. This is important as it can help when choosing storage and delivery systems.
Without changing anything, including usage behaviour, I could get an inverter that has a maximum power delivery of 14 kW and know that all my usage would be covered. Storage, for one day, without any inputs, would need to be at least 26 kWh once 20% efficiency losses are taken into account. The 20% losses are based on a ‘best guess’ as this is a very variable percentage based on different power draws, battery charging and discharging temperatures and the state of charge they are at.
So what do I use my energy for. Luckily, being on E7, I can easily see what is used for water heating and what is everyday usage.
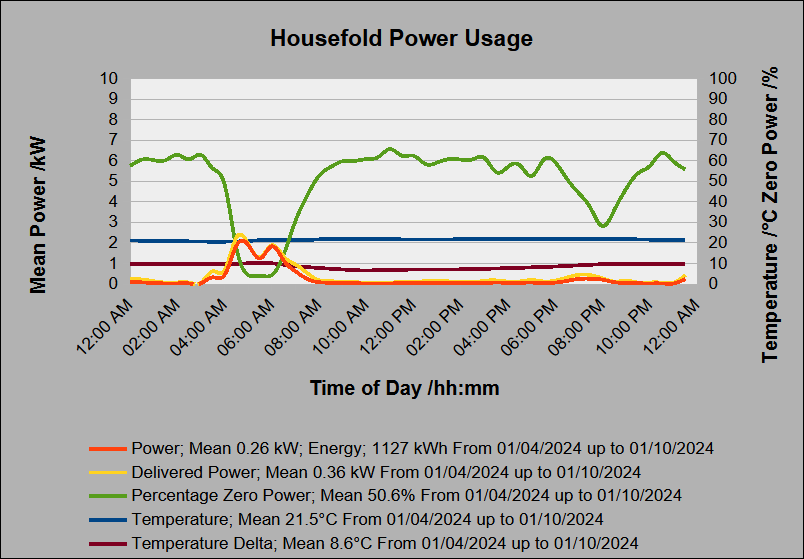
By looking at my April to November night usage, I can get a fairly good estimate of my domestic hot water usage.

Chart 2
Chart 2 above shows the half hourly usage between April and up to November, when there is no space heating on.
The mean usage over that period is 4.2 kWh, so apart from the washing machine usage and the fridge switching on, it is fair to assume my daily water energy usage is around 4 kWh/day. This is bourne out my my higher than average water usage. One of my many failing is that I like a bath, every day, and would have two a day if I did not curb my enthusiasm.
If I fitted a heat pump, to heat the water, I could probably reduce that down to 2 kWh/day. Or if I took showers, less than 1, but I dislike having a shower, though they are good at getting the day’s fat, blood and grizzle off my body after work.

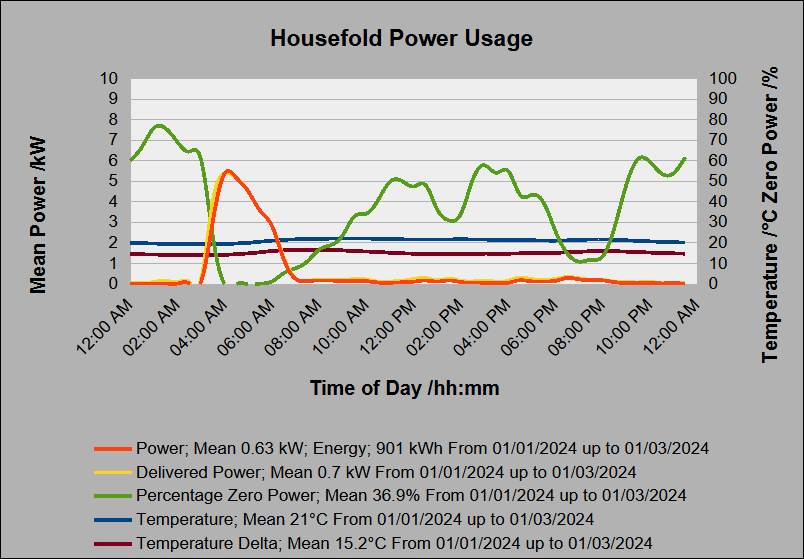
Chart 3
Chart 3 shows the same data, but for January and February when the storage heaters where on. The daily mean, for space and water heating, has increased to 12.25 kWh/day, so 8 kWh/day are for space heating. This works out as a power delivery, for my house, of 27 W.m-2. Using a heat pump could reduce that by a factor of 3, so less than 2.6 kWh/day or 9 W.m-2.
Looking at the mean internal air temperature, I see they are within 0.5°C. This is good as it shows that my heating regime is working well and does not need adjusting.
So having got my usage figures, and estimated some usage figures if I changed to a heat pump, what can be done about generating energy on site to cover approximately 8 kWh/day.
My house is small, and the roof will only support, at the very most, 3 kWp of photovoltaic. It is also less than ideal facing with the optimal side facing South West.
Looking at PVGIS to get an estimate of what I could generate, highlighting December because it is the worse month and with similar usage to January, it shows that there would be a total generation of 24 kWh.
That works out as around 0.75 kWh.day-1
It is not until April that I could cover my usage, and by October a deficit would be showing.
The deficits are in the table below.
|
Month |
Usage /kWh |
PV Generation /kWh |
Deficit |
|
January |
248 |
31 |
-217 |
|
February |
232 |
58 |
-174 |
|
March |
248 |
129 |
-119 |
|
October |
155 |
83 |
-72 |
|
November |
180 |
38 |
-142 |
|
December |
248 |
24 |
-224 |
Whiles the above energy deficits are not that large, they need to be covered.
Even if a battery storage system was installed, without the generation capacity, regardless of how spasmodic the generation, it would still not be covered.
The only realistic generation method is to use a small generator.
Using December’s data, as it is the worst month overall, on average, a 2 kW generator would have to run for 4 hours a day once efficiency losses where taken into account. During these 4 hours, a battery system of 26 kWh capacity, could be efficiently charged with 8 kWh of energy. By having an oversize battery storage system, more effective charging and discharging can take place, and the system will have a longer lifespan. It also allows for some days to probably not run a generator at all depending on the weather.
My choice for a generator would be bottled gas (LPG). While diesel may offer a small improvement in efficiency, they are noisy and if the stored fuel gets some water in it, can be expensive to rectify or repair. Gasolene to LPG is a tried and tested conversion.
Ideally a combined heat and power (CHP) unit would be used as these offer the best possible efficiency with about 30% of the fuel input turned into usable thermal energy and 20% into electricity. Unfortunately there are no easily available small CHP units or around 5 kW total output.
This would mean that a DIY solution would have to be made. This would be an interesting project. There are some small capacity, water cooled, twin cylinder motorcycle engines that may lend themselves well to this application. There are also cheap, permanent magnet, low speed, direct current current motors that can be driven as a generator.
Noise would be the biggest problem with a generator, but as it may only run for a few hours a day, then it can be used during the daytime. It can also be buried in an earthen bank, with secondary inlet and exhaust systems fitted. Modern cars are very quiet at low revolutions, no reasons that a modern motorcycle engine should be any different. My car, and old diesel is quite quiet at tickover, and it is using 1 kWh of fuel per hour.
So to conclude, while it is not possible for me to be ‘off grid’, with a larger, more isolated property, and the use of a generator, and about £25,000 of investment, I could be off grid.
Edited by SteamyTea
-
 2
2


7 Comments
Recommended Comments
Create an account or sign in to comment
You need to be a member in order to leave a comment
Create an account
Sign up for a new account in our community. It's easy!
Register a new accountSign in
Already have an account? Sign in here.
Sign In Now