

My Enery Monitoring

Entry posted by SteamyTea in My Energy Usage January 2019 to Octobe 2024
1531 views
As many of you know, I like to measure everything. My energy usage is just about the top of the list, and as I have got a new PC with a bit more power than the old one, I have been able to analysis several years data in one go.
The main areas I have been monitoring are electrical energy usage, in my all electric house, internal and external temperature, and a weird one, zero power draw times.
For the last decade or more, I have been using a CurrentCost Envi, this has an optical sensors that counts the number of 1Wh pulses off the main electrical meter. It is what gave me the idea to design a similar one.
Over the last couple of decades, I have slowly been improving both the fabric of my house by replaced old glazing, but not frames, added 'lockout times to limit the E7 window, bought lower powered electronics, added insulation and improved airtightness. The biggest thing I have tried to do is to make sure that there are no parasitic loads, this is where the Zero Power Draw metric comes in. This got me thinking that if I ever went for battery storage, which usually has a minimum power draw to start, with 200W often being quoted, would it be of any use to me.
In August 2023, I foolishly agreed to a smart meter being fitted. Now I have no objection to a smart meter, in fact, I quite like them. The problem was that my energy supplier EDF, fitted a dud, then spent months sending me incorrect bills, took weeks to replace it, changed my contract without informing me, and eventually had to give me a couple of hundred quid as compensation, so not all bad.
What this has allowed me to do is to calibrate my CurrentCost meter. Since the beginning of the year, which is the only time I have reliable smart meter readings from, until the beginning of this month, October 2024, my smart meter has registered 2383 kWh, while my CurrentCost has registered 2349 kWh. Taking one from the other, dividing by the smart meter amount, multiplying by 100 gives me a percentage difference, 1.4%. So not exact, but can probably be accounted for for the few times that I have disconnected the CurrentCost (moved it, sender battery went flat, other disconnects). One year, I shall have a trouble free, 100% full readings.
So now some charts.
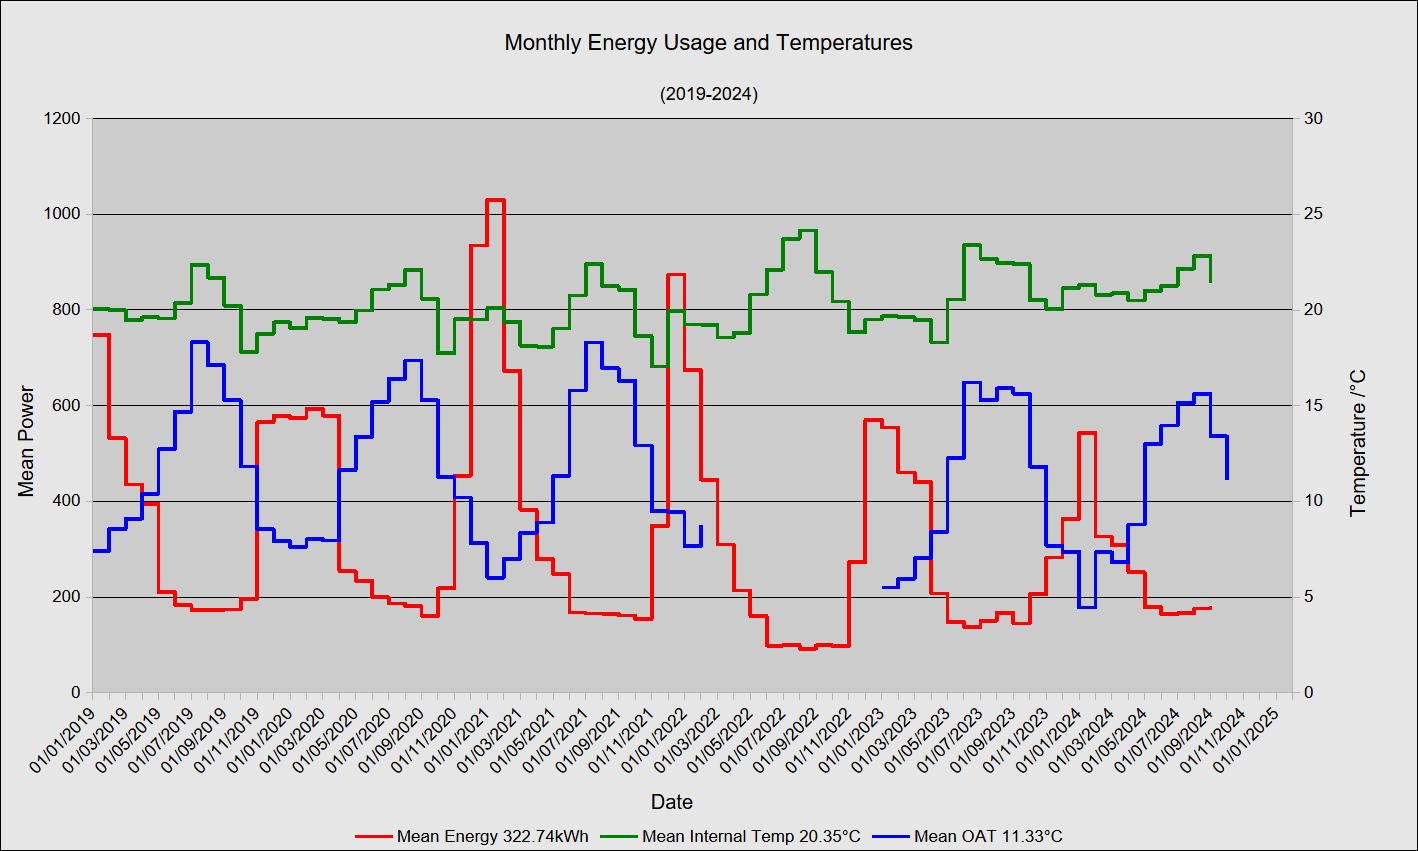
This first one is a time series since the beginning of 2019. There is a little break in the outside air temperature readings (was using a DHT22 and it probably got wet in a storm). There are times when I get seemingly high readings which are caused by the sensor being hit by full sunlight, but for 22 out of 24 hours a day, the readings are good, and I can filter out the over temperatures if I need to. I have a plan to improve this by making a shield, but going for a coffee is more fun than doing 'engineering'.
When we had the energy price shock back in 2022, I added triple glazing to my windows. This was a cheap option (about £120) and after the first winter I noticed that I did not have to turn my storage heaters on until the mean outside air temperature went below 9°C for a few days. This was a degree lower than before. I also noticed a drastic reduction in sound transmission from outside. There is an energy reduction that is quite clear on the charts, even though there is missing temperature data, though luckily during the summer.
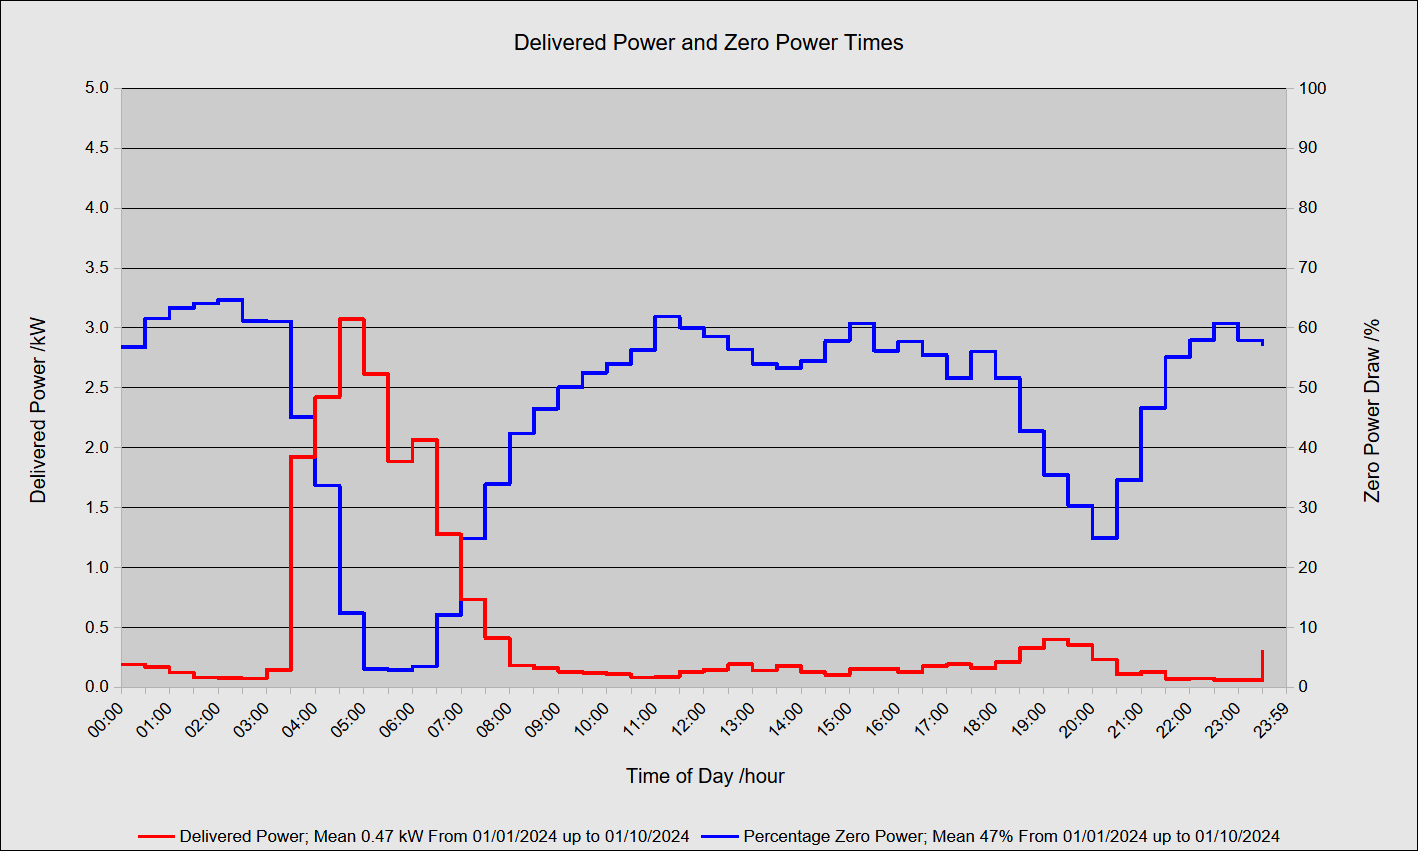
This second chart shows the mean power by time of use and the percentage of time that the house draws no energy from the grid.
0 Comments
Recommended Comments
There are no comments to display.
Create an account or sign in to comment
You need to be a member in order to leave a comment
Create an account
Sign up for a new account in our community. It's easy!
Register a new accountSign in
Already have an account? Sign in here.
Sign In Now